
The TL;DR summary
Over a 12+ hour run, bi(OS)’s real-time OLAP engine delivered a p99 latency of 1.46ms for inserts, 2.94ms for selects at a peak throughput of 21.5K rows/sec with an 80:20 write: read split for 1KB rows when the system is 70%+ utilized. Writes followed ⅔ QUORUM durability across three availability zones, reads were always consistent, and both bypassed the FS cache. The TCO of this solution is $0.004/sec on GCP (Google Cloud Platform).
| Avg. over 12 hour period | insert | select |
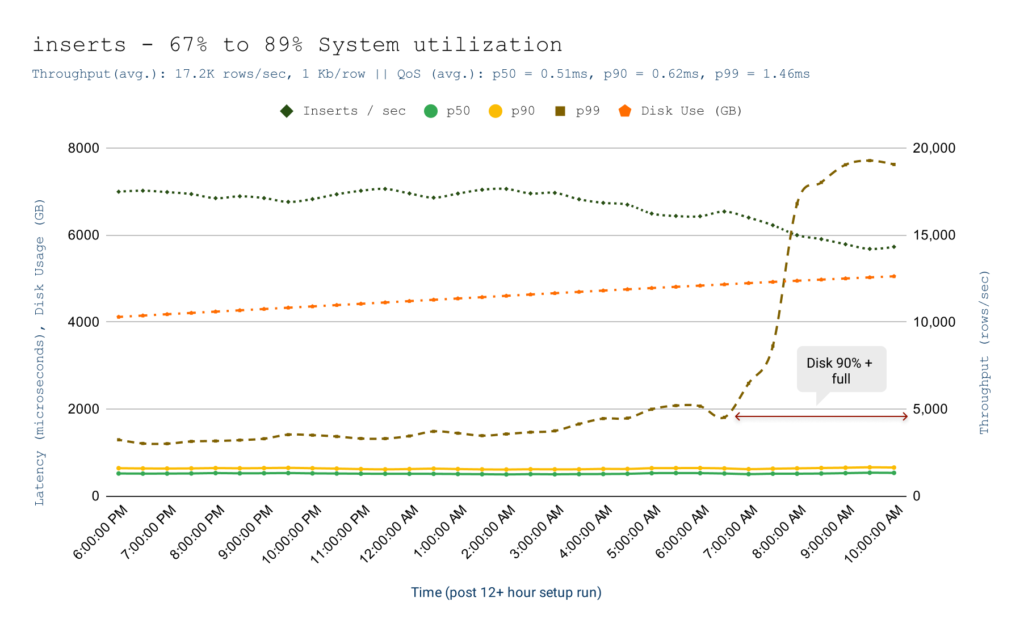
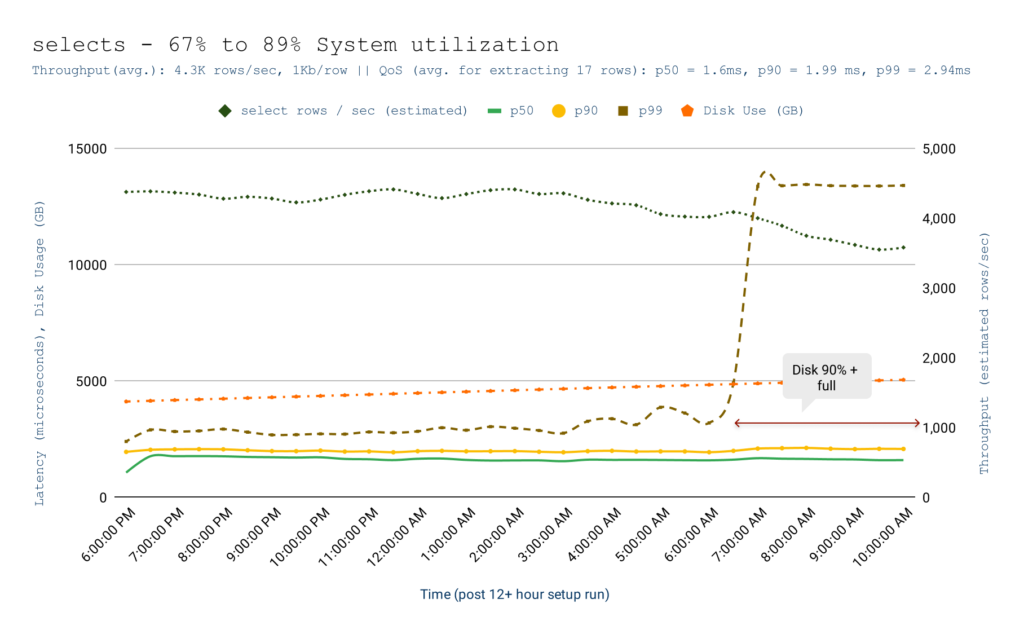
| Throughput | 17,200 rows/sec | 4,300 rows/sec1 |
| p50 latency | 0.52 ms | 1.60 ms |
| p90 latency | 0.62 ms | 1.99 ms |
| p99 latency | 1.46 ms | 2.94 ms |
Use-Case Definition
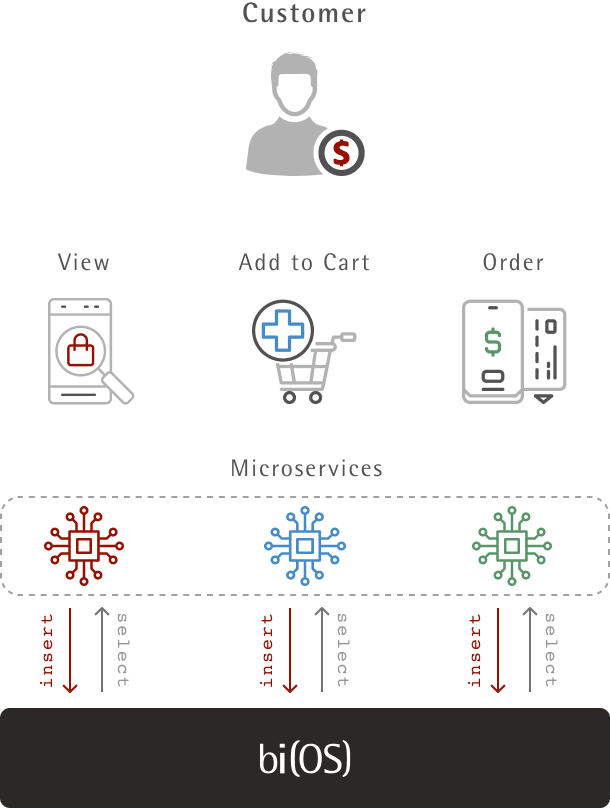
One of the critical aspects of any benchmark is the use case it serves. Instead of picking some theoretical standard, we picked a real-world use case. Since bi(OS) is in production serving mission-critical use cases at Tier-1 eCommerce players2; we chose to model our tests around that domain. Specifically, how can recommendation engines be improved in real-time3? Imagine a typical user behavior in online commerce – users view products, add a few of them to the cart and then place orders. Let’s define the data model and access pattern for this use-case.
Data Model and Access Pattern
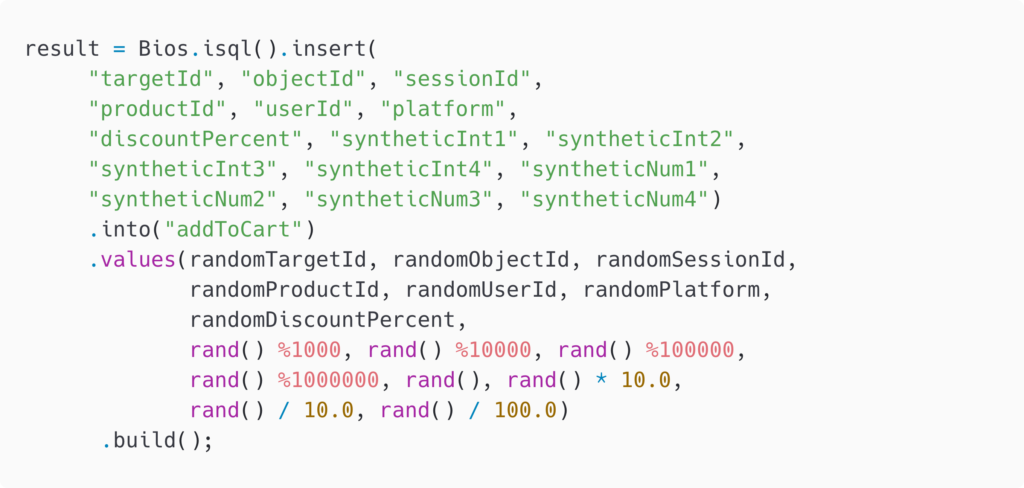
- Each event included 30+ columns with various data types – string, boolean, integer, number to represent user, product, session, price, etc.
- The typical size of the event was 1KB.
- Benchmarks tests used random distribution to ensure –
- Real-time auto computation of features (see below) is stressed for the worst case.
- Results for selects that include sort and filter4 by high-cardinality dimensions (e.g., userId), aren’t artificially skewed.
- Read/Write characteristics:
- Write : Read ratio would be 80 : 20
- Every user interaction (click, scroll, hover) is inserted into bi(OS)
bi(OS) auto computes aggregates, indexes, and sketches in real time. There were nine features for aggregates on numeric columns. There were two features with groupBy on string columns – one with a single dimension of medium cardinality and one with a composite dimension (made from three columns) of high cardinality.
- Read features (aggregated and indexed) on every user click from bi(OS) via selects.

Note that while aggregate features from yesterday’s or last hours data can be easily computed and “cached,” utilizing fresh features for a specific user (a high-cardinality dimension) is what separates winning recommendation engines from mediocre ones. Since bi(OS) auto-computes these features – aggregates, sketches, and indexes – during inserts, feature queries would have shown favourable results. Instead of limiting ourselves to features, we decided to test for online learning with selects of raw events to test the worst-case performance.
- inserts and selects followed the following characteristics:
- All writes are made durable with ⅔ QUORUM across three zones5
- All writes use the O_DIRECT to bypass the file system cache
- All reads ensure that they read consistent data
- All reads avoid reading from RAM
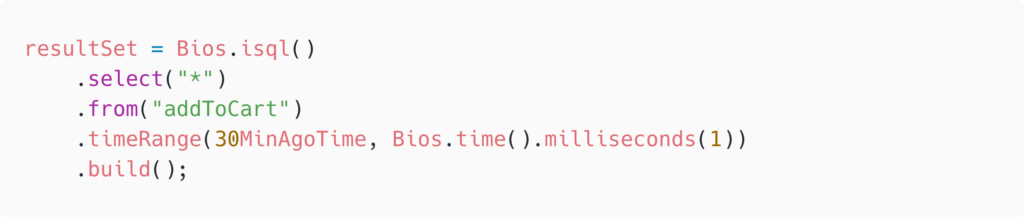
- selects intentionally read data that was inserted 30 minutes ago to ensure reads are coming from storage (as opposed to in-memory cache). Reducing this time made our select latencies look artificially good, which we verified and decided against publishing. Further, we ensured no row is read twice.
Test Setup and Methodology
After setting up bi(OS) on GCP, a concurrent insert/select load was run for 12+ hours to fill up storage up to 67%. Measurements during this time were not published as they would show metrics as artificially good.
Further, test concurrency was adjusted to saturate systems components (CPU, Storage, Network) up to ~70%. When measurements were published, the system was under the following load –
- CPU – 65%-75% utilized
- Storage – 67% – 89% utilized (continuously increasing linearly)
- Memory – 40% Utilized
While measurements are published after storage was 90%+ full, they are only for the purposes of engineering honesty. We don’t recommend running any system (let alone bi(OS)) when storage is 90% full.
Measurements of throughput and latency were recorded every 60 seconds and every 30 minutes. We are publishing the 30-minute results as the 60-second results will make QoS look significantly better.
Insert Results
Select Results
Conclusion
The cloud is inherently non-deterministic. The Modern Data Stack exacerbates this, severely curtailing the last mile AI/ML use-cases or requiring an unaffordable TCO for anyone but a select few. Isima’s engineering team has changed that equation today, and we are only getting started. Do you want to imagine with us how to tame the p{99.9, 99.99, and 99.999} latencies? Reach out to us @ imagine@isima.io.
P.S: Did you notice we never reported mean latencies and always measured latency end to end – i.e. clients were blocked during reads/writes. That’s what we mean by engineering honesty.
2. Scaling to thousands of operations/sec for over a year.
3. Some in the industry refer to solving these problems as real-time learning, multi-armed bandit inference, etc.
4. Note that for benchmarking purposes we didn’t perform selects with sorts/filter as we went with selecting raw events.
5. Tests were done in GCP’s us-east-1 region.